Crude Oil has been trading sideways, with a slight bearish
tone over the last 24 hours. This comes
after a 24-hour period where price-action moved over $7.00 from 105.50 all the
way up to 112.24.
 |
| Crude Oil VIP Chart |
This morning we can see that price-action is trading on top
of the PLOD 109.11 with a very narrow overnight trading-range. We can see support zones below us at 108.90
and 106.99 on the 30-minute VIP Chart, along with resistance zones overhead at
110.42 and 111.46. It is a very big
concern this morning when we see the price-action on top of the PLOD with a
narrow trading-range coming out of London.
This tells us the market personality is lacking confidence to one side
or the other and we will need to be careful this morning until something
changes.
 |
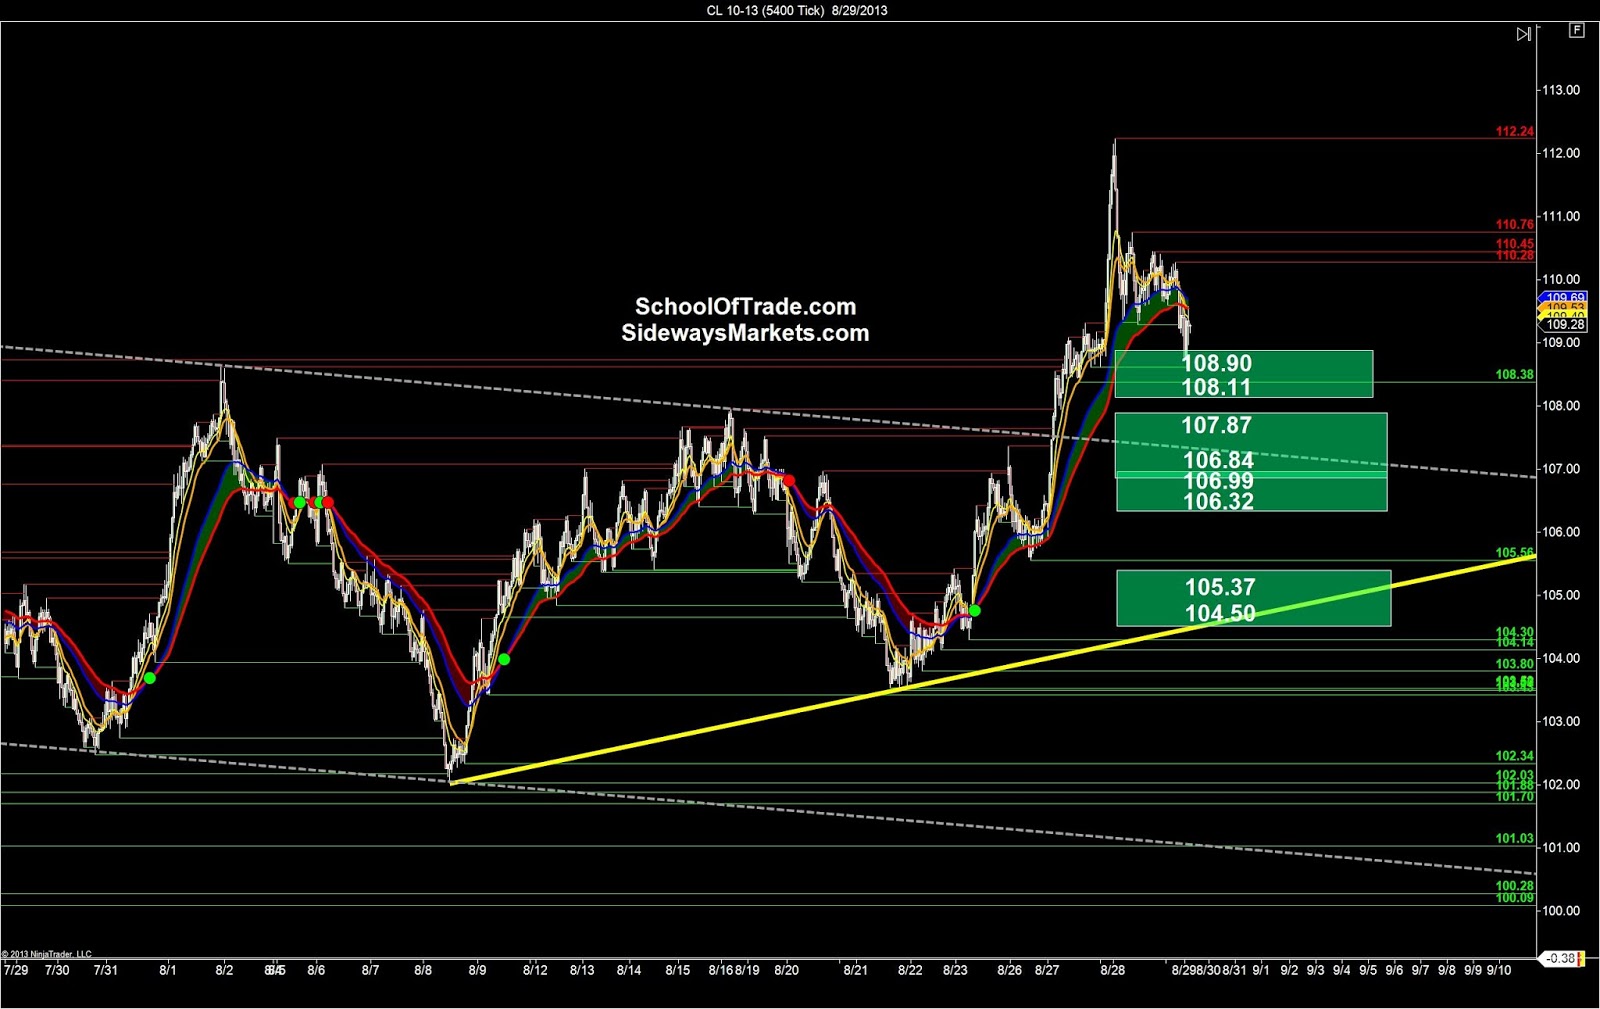
| Crude Oil Anchor Chart 1 |
The 5400-tick anchor chart shows us lots of support zones
below us to use as we pull back off these fresh highs. We can see support levels at 108.90, 108.11,
107.87, 106.84, 106.99, 106.32 and 105.37.
As price tests these support levels we are looking for a price-reversal followed
by a buying opportunity with the Wave pattern.
If these support levels are broken, that shows signs of
selling-strength, we can look for a selling-opportunity below each support level,
but we know that buying with the long-term trend will provide the high-percentage-trades
we’re looking for this week.
 |
| Crude Oil Anchor Chart 2 |
We can see a lot more information on the 1800-tick chart
today. First, we recall the previous
highs at 108.74 and that reminds us that we are almost back below the range
highs from before the big move up earlier this week. This is a big clue for a possible collapse in
price-action today and tomorrow.
Remember, whenever we see a big POP, we often see a big DROP a few days
later, so we will certainly be looking out for that today.
We can see a multi-level support zone below us at 108.90 and
108.87, with a very strong trend-line right below it. We can easily see that selling short at this
area is going to be a challenge, so we will be careful not to sell directly
into the support zone below, rather we will wait for price-action to move below
the 107.95 and then look for selling-opportunities down to 106.99.
 Look closely at the trend-line resistance on the 1800-tick
chart and remember too that if we decide to get long this morning we will need
to trade around that trend-line. The
best plan is to wait for a breakout above the 110.85 area so we clear both the trend-line
and the swing-high above it. Look for a wave-pattern-long
if we can get above the 110.85 area today and use the 111.46 and 112.24 as your
profit-targets on the trade.
Look closely at the trend-line resistance on the 1800-tick
chart and remember too that if we decide to get long this morning we will need
to trade around that trend-line. The
best plan is to wait for a breakout above the 110.85 area so we clear both the trend-line
and the swing-high above it. Look for a wave-pattern-long
if we can get above the 110.85 area today and use the 111.46 and 112.24 as your
profit-targets on the trade.

No comments:
Post a Comment