 |
| Crude Oil News |
 |
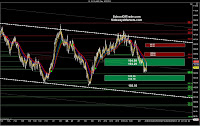
| Crude Oil Anchor Chart 1 |
Crude Oil jumped higher overnight after testing the 103.50 area
late in the day on Wednesday. This
morning we find Crude Oil trading inside the zone from 104.99 down to 104.29
and we will be looking for additional clues this morning to tell us whether
this price-action is going to go higher up to resistance at 105.24, or if it
will drop lower and reach the 103.30 support.
 |
| Crude Oil 30-Min VIP Chart |
Our 30-minute VIP chart shows us that price-action has been
moving higher off the PLOD since early in the overnight session. We can see the PLOD at 103.50 and the PHOD from
Wednesday up at 105.14. We know that price-action
will most likely be trying to test the PHOD, so we will be using that as a
directional clue this morning.
We can also see a price-wedge on the 30-minute chart which
may be trouble for the buyers this morning.
As price is rising higher off the PLOD it may be stalled-out at the highs
of the price-wedge when it runs into the trend-line resistance around
104.60. We will be watching the market
personality very closely around the highs of the price-wedge this morning because
we need to anticipate the sideways-trading-range if it develops.
 |
| Crude Oil Anchor Chart 2 |
Our 2nd anchor chart, the 1800-tick, shows us
moving lower in a short term bear price-channel while moving through the support
zone at 104.99 to 104.29. Now we have price-action
jumping back higher this morning and we have defined resistance zones overhead
at 105.24 and 106.23, which we will use for a profit-target for the buyers and
a selling-opportunity for the sellers today.
The long-term trend appears to be bearish with the price-channel and the
red-cloud so we will be looking for selling-opportunities as the high-percentage-trades
this morning, and those selling-opportunities will most likely occur at 105.24,
105.64, 106.23 or 106.57.
Our day trading plan today will be to follow the trend on our
anchor charts. We can see that early in
the session we will most likely have a bullish market sentiment because of the
jump higher overnight, while in the long-term we expect to see the price-action
turn around and move lower. When the
trend changes to bearish again later this morning we will be looking forward to
selling short using the long-term trend and the bear price-channel on the
anchor chart.
 |
| Join us for Live Trading! |
No comments:
Post a Comment