Friday, June 28, 2013

Crude Oil Day Trading Strategy Morning Prep 06 28 13


Crude Oil Weekly Chart


Crude Oil 240-Minute Chart:

Crude Oil 240-Minute
Crude Oil has pushed higher this week, coming off the lows of the bullish price-channel on the 4-hour anchor chart.  

With this jump higher in prices we are reminded that a pullback is more than likely this morning before we move higher again, so look for short term selling-opportunities this morning but keep an eye on the major support levels below us in order to find the best location to get into the trade long.  We can see buy-zones below us at 97.16 and 95.74 on the 4-hour chart of Crude Oil and we will use those as high-percentage-trades to trade with the long-term trend higher.

Crude Oil 60-Minute Chart:

Crude Oil 60-Minute
The hourly anchor chart shows us the strong bull price-channel has indeed helped push the price-action higher, and now we see major trigger-zone resistance overhead at 97.81 has stalled the buyers for a moment and we expect to see a pullback to the trigger-zone support levels below us at 97.19, 96.82, 96.65 and 95.98.  We are looking for price-action to move HIGHER off these support levels and then we will enter long buying pullbacks using our entry charts this morning.

Crude Oil 5-Minute Chart:

Crude Oil 5-Minute
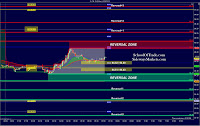
We can see price-action testing the reversal-zone at the bottom of the London trading Session so we are looking for buying opportunities right now at the support at 97.20-97.03.  We can see a price-wedge using two trend lines and we are trading on top of the PHOD.  

Trading on the PHOD tells us the buyers are thinking about making new higher-highs today but as of now they have not been able to keep price above the PHOD and moving higher.  This leaves the door wide up for all 3 directions this morning.  Price-action may sit on top of the PHOD with the Dollar-Index being so narrow this morning, and we will sit-on-hands in that scenario.  

The price-action may push higher because above the PHOD we consider this market sentiment as bullish, and already know the longer-term anchor charts have already told us to buy pullbacks in the long-term trend higher this morning.  

Price-action may also drop lower this morning, and we can see a mj buy-zone waiting for us at 96.65 if this price-action decides it needs to pull back even further this morning.  Our plan today is to look for a price-reversal off the support levels below us and then look to get long as we finish up this very BULLISH week of trading.

Thursday, June 27, 2013

Crude Oil Day Trading Strategy Morning Prep 06/27/13


Martys PIT Session Levels

Martys PIT Session Notes

Crude Oil 60-Minute
Crude Oil is trading inside a narrow trading-range this morning as it ‘grinds’ higher this week.  We can see major resistance zones above us on the 60-minute anchor chart, along with a trend line as support below us.  This price-action is most likely going to result in 2-sided trading, so we will be looking to buy-the-lows at support and sell-the-high at resistance with a bias to the buy-side considering the bullish market sentiment we’ve seen in the markets this week.


Crude Oil 5-Minute
We can see a very narrow range in the London trading Session and the 5-minute chart shows us the reversal-zone below the range has recently been tested, which means we are bullish in the short term, and we will wait to see what the 8:30am EST news comes out as before we know more.


Crude Oil Daily 


Crude Oil 240-Minute


Dollar Index 60-Minute 
The Dollar-Index is clearly moving higher this week, inside a bullish price-channel and we have a little more room to go before we test the resistance trend line overhead on the 60-Minute chart.  This leaves room for some higher prices this morning as we go into the opening bell on Thursday.

The Dollar-Index is trading at the highs of the overnight range, suggesting a minor pullback is coming before we try to make new higher-highs this morning.


Wednesday, June 26, 2013

Crude Oil Day Trading Strategy Morning Prep 06/26/13


Martys PIT Session Levels

Martys PIT Session Notes
Dollar Index Correlation:

Dollar-Index 60-Minute
The Dollar-Index is moving higher again this morning, which is telling us that the Dollar-Index-correlation says to look for selling-opportunities for the high-percentage-trades today.  The 60-minute chart shows us the bullish price-channel along with the highs of sell-zone at 83.165, which means above this level we have wide open space for the Dollar-Index to keep moving higher.  Look for the rising Dollar-Index to push prices lower this morning on Gold, Euro, and Crude Oil.

Crude Oil Futures:
Crude Oil 60-Minute
Crude Oil is trading in the middle of the range on the 60-minute anchor chart this morning, with support below at 94.42 and resistance above at 95.94.  These technical clues tell us to expect 2-sided trading this morning without much room to move higher or lower without something getting in our way.  We will need a strong market personality either higher or lower this morning to feel confident with trend-trading.  If we do not see strong market personality in either direction we will look for price-reversal patterns to buy support and sell resistance.  Remember the Dollar-Index looks bullish, so the short-side will most likely be the direction it will move first, but again, with the support below us we know that look for the price-reversals will likely be the high-percentage-trades this morning.

Crude Oil 5-Minute
We are trading in the middle of the London trading Session on the 5-minute chart this morning, after testing the trigger-zone support at 94.82 we are now looking to head to the highs of the range again before testing the reversal-zone at 95.37.  We will be looking to sell-the-high at resistance and buy-the-lows at support of this trading-range today.


Support Levels Below:
94.82, 94.69, 94.51, 94.40, 94.27, 93.97, 93.59, 93.17, 92.67, 92.49

Resistance Levels Above:
95.37, 95.67, 96.05, 96.17, 96.47, 97.08, 97.15, 97.23


Tuesday, June 25, 2013

Crude Oil Day Trading Strategy 06/25/13


Martys PIT Session Levels

Martys PIT Session Notes

Crude Oil 60-Minute
Crude Oil is trading into major resistance this morning with both sell-zones and trigger-zones in our way before we can move higher.  Price has jumped all the way off the 92.50 level up to trading at the 96.00 big-round-number this morning.  The buyers have their work cut-out for them today if they want to keep pushing higher.  We will use this major resistance overhead as an easy reason to look for SELLING opportunities this morning, which also goes in-line with what we saw from the Dollar-Index-correlation.

Crude Oil 5-Minute
The 5-minute VIP chart shows Crude Oil trading at the highs of the London trading Session, which tells us the bulls have definitely been hard at work overnight.  After seeing the 60-minute chart we know that these buyers may be almost out of ‘gas’ at these highs, and we will be looking for a fake-out-breakout of the highs for a short-selling opportunity this morning. 

Support Levels Below:
95.61, 95.49, 95.33, 95.23, 95.12, 94.86, 94.52, 94.15, 93.56

Resistance Levels Above:

96.09, 96.36, 96.69, 97.01, 97.06, 97.23, 97.63

Monday, June 24, 2013

Crude Oil Morning Prep; Screen to Floor Trading Strategy


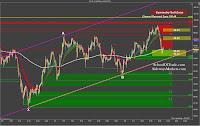
Crude Oil Trades in the middle of the range this morning, with a slight bullish market sentiment as we open the new week of trading.

Friday, June 21, 2013

Crude Oil Morning Prep & Day Trading Strategy 06/21/13


PIT Session Notes

PIT Session Price Levels


Economic news today:
This morning is Quadruple Witching Friday, which means today is the final trading day before all 4 asset-classes expire on Saturday.  The result of this will be lower-than-usual trading volume, and a lack of consistency in the price-action on our charts.  Traders are encouraged to trade lightly this morning, using smaller contract sizes, and being more conservative with risk-management.

Crude Oil Daily Chart:
Crude Oil Daily
It appears we were very accurate in our Thursday morning prediction of a sell-off and this morning we finish up a week of trading with a large GAP in price on the daily chart with price sitting on top of the 95.43 buy-zone, which was identified earlier this week.  This daily chart tells us that we are sitting at support on this chart, which means we may see a rally this morning back higher, or the buyers may fail and this price can keep tumbling lower back to the 92.00 level.

Crude Oil 240-Minute Chart:
Crude Oil 4-Hour 
The 4-hour anchor chart shows us a lot more details this morning, which we will use to make educated trading-decisions this morning.  First, if you recall from Thursday we discussed that buying the lows of the price-channel would be the high-percentage-trades of the week, and we are now trading at those lows.  We will be looking for buying opportunities this this morning with price-action sitting on top of major support at the price-channel lows and a profit-target at 96.92 and 98.23. 
We should also be aware that if price keeps dropping lower this morning we also can buy the lows of the price-channel as far down as 93.94 so we will look for the high-percentage patterns for entry long, but if that isn’t working and prices slip back lower we still can be patient for another buying opportunity.

Crude Oil 60-Minute Chart:
Crude Oil 60-Minute
The hourly anchor chart tells us exactly what to expect in the short-term trend this morning we go into Quadruple Witching Friday.  First, we must remember that this morning is going to be sloppy.  Most of the professionals on the trading floor will NOT be trading today, which means lower volume and less consistency in the trades that we take.  For that reason, we must use caution this morning.
The 60-minute anchor chart shows us bouncing off the 95.00 big-round-number as we tumbled off the weekly highs.  We want to buy this dip in prices, the 4-hour chart shows us trading at the lows of a price-price-channel, but we have some resistance in our way.  Price-action is testing the 95.46 sell-zone right now, which means we can expect to see lower prices before we see higher prices this morning.
The 60-minute chart of Crude Oil tells us to wait and buy a pullback this morning at 95.24 before trying to buy into the sell-zone overhead.  We will look for profit-targets overhead around 95.86, 96.14, 96.56 and 96.80. 

Crude Oil 5-Minute VIP Chart:
Crude Oil 5-minute VIP
The 5-minute VIP chart shows us a very narrow trading-range overnight as professional traders are stepping away from their desks for Quadruple Witching Friday.  A narrow trading range tells us to be careful this morning with fake-out-breakouts and to look for buying opportunities at the support levels below, and selling opportunities at resistance overhead.  If prices push lower this morning we are looking for the high-percentage-trades to buy around 95.24 down to 95.09.  If prices rise higher this morning we are buying pullbacks above the lows of the London trading Session and taking a profit-target at the reversal zone at 95.84.

Support Levels for Today:
95.41, 95.29, 95.24, 95.14, 95.09, 94.98, trend line around 94.85, and 94.71.

Resistance Levels for Today:

95.57, 95.63, 95.72, 95.78, 95.84, 95.96, 96.11, 96.27 and 96.54

Thursday, June 20, 2013

Crude Oil Morning Prep; Screen to Floor 06/20/13


PIT Session Notes
PIT Session Levels


Economic News this morning:
We have major economic news on the calendar this morning starting with Jobless Claims at 8:30am EST.   We have the Philly Fed Index & Existing Home Sales at 10:00am EST this morning, and for all the Natural-Gas traders we have Inventories at 10:30am EST.
Crude Oil Daily Chart:
Crude Oil Daily
This morning we can see that the sell-zone overhead has held with too much supply entering the market after the FOMC Report on Wednesday, and prices have dropped off the recent highs as we go into the opening bell in the US morning trading session.  We have defined a daily support level of 95.43 below us this morning, which should be a target for the sellers over the next 2 days.

Crude Oil 240-minute chart:
Crude Oil 240-Minute 
The 4-hour anchor chart shows us that prices have dropped off their multi-week highs and have landed on top of trend line support and buy-zone support at 96.74 down to 96.15.  This is a VERY important area for Crude Oil traders this morning.  If prices can successfully climb back higher we will likely see prices move up to 100.0 and possibly 101.0 over the next week.  On the other hand, if prices collapse below the 96.15 we then know that the buyers have failed, the sellers will take control, and prices will drop to 95.35 and 94.43. 

The bull price-channel on this 4-hour chart still tells us to buy pullbacks at support, so look for rising prices EARLY this morning to get into these long positions.  We also know that if we do NOT see those rising prices we will likely see a collapse and we will look for selling opportunities down to the 95.35 buy-zone below us.

Crude Oil 60-Minute Chart:
Crude Oil 60-Minute
The hourly anchor chart of Crude Oil shows us just how much of a drop in prices we’ve seen over the last 24-hours.  Clearly the reaction to the FOMC Announcement on Wednesday was bearish, so this morning we can see price-action resting on top of a trend line in the middle of a range between buy-zones below at 95.86 and the next sell-zone overhead at 96.73, 97.63, and 97.93. 

We can easily see that the price level at 96.50 is an important turning point in the market this week.  If prices rises back higher from here we know this reaction to the news on Wednesday was just a pullback in the long-term trend going higher.  If we do not see prices move higher we know this ‘pullback’ is more like a price-reversal and we will see prices tumble lower to the 95.86, 95.59 and possibly the 94.75.

Crude Oil 5-Minute VIP:
Crude Oil 5-Minute
The 5-minute chart on Crude Oil shows us a narrow trading range, and we are right in the middle of the overnight trading session.  This market personality tells us that ANYTHING can happen this morning.  We expect to see short term bullish market sentiment this morning as the traders in the US return to their desks, however we do not know if these bulls will last very long because of the bearish news from the FED on Wednesday.

The day trading plan this morning for Crude Oil is to determine the market sentiment as we come off major news from the FED and look for clues to see where the traders are going to go from here.  We can easily see prices jump higher this morning after the big sell-off overnight, but we would also see the sellers come back in this morning and this price may keep tumbling lower.  As of 8:00am EST we are selling at resistance, and buying at support and waiting to see where the long-term trend will be this morning so we can trade along with it.

Support Levels today: 
96.05, 95.73, 95.32, 94.87, 94.26, 94.14
Resistance Levels today:

97.23, 97.55, 97.63, 98.00, 98.41, 98.53, 98.85, 99.14, 99.21

Wednesday, June 19, 2013

Crude Oil Morning Prep; Screen to Floor 06/19/13


Join us HERE.

Marty's PIT Session Levels


Crude Oil Contract Rollover Alert:
This morning we have rollover-over to the next front-month contract for Crude Oil Futures.  This morning we move to the 08-13 Futures contract, and you can learn more about how to accomplish this here.

Economic News Alert:
This morning has 4 big news events that we need to be aware of.  First, today is Wednesday of OPEX, so we know that today is called ‘wacky Wednesday’.  Second, we have contract rollover on Crude Oil which will have traders moving to the new 08-13 contract.  Third, we have Crude Oil inventories today at 10:30am EST which will have traders waiting to hear from the EIA to see if there was another draw in Crude Oil inventories to support higher prices this week.  Fourth, today is FED DAY or FOMC Day, which means today we will hear from the Federal Reserve Bank in the US with their announcement at 12:15pm and the Press Conference at 2:15pm EST this afternoon. 

Crude Oil daily chart:
Crude Oil Daily Chart
The daily chart of Crude Oil shows us exactly what was expected earlier this week; we can see rising prices on the way up to the 100.00 big-round-number overhead.  We can see that price-action is pushing into a sell-zone at this time, with major resistance at 99.44, and the highs of the price-channel.  We can expect prices will continue to push higher until we test 100.00, and we expect to see prices attempt to test the highs of the bullish price-channel. Join us HERE.

Crude Oil 240-Minute:
Crude Oil 240-Minute Chart
The 4-hour anchor chart shows us wide open space above us on the way higher to 100.00.  We have been calling this market personality bullish all week, and this morning it is likely to continue.  We can clearly see the bullish price-action pushing higher this morning, telling us that buying at support with a price-reversal or buying pullbacks will easily be the high-percentage-trades this morning.   We have our next sell-zone overhead at 99.51 and that is our short term profit-target this morning.  Our long term target today and tomorrow will be 100.00 and 100.40.

Crude Oil 60-Minute chart:
Crude Oil 60-Minute Chart
The hourly anchor chart shows us a lot of important clues to help us get started trading this morning with the long-term trend.  First, we can see the bullish price-channel tells us to buy pullbacks with new higher-highs and to look for price-reversals at support levels below us to get LONG.  Second, we can see short term buy-zones below us at 98.41, 98.22, 97.94 and 97.78 which we will use to buy at support this morning if price pulls back from the overnight highs.  Third, we can see a wide open space above the sell-zone at 99.15 which tells us that if price-action jumps higher we can easily buy pullbacks using our simple entry rules, using the top of the price-channel and 100.0 big-round-number as our profit-targets above us.  Join us HERE.

Crude Oil 5-Minute VIP Chart:
Crude Oil 5-Minute VIP Chart
We can see a narrow overnight trading range this morning on the VIP-Chart, with plenty of locations to look for buying opportunities this morning at the levels of support we’ve located on this chart.  Look for key price-reversal locations around the reversal-zone at 98.84, the trigger-zones at 98.42 and 97.97 this morning, and remember the long-term trend is bullish so we will be looking for price-reversals off these support levels below. 

Support levels today: 
98.84, 98.74, 98.61, 98.47, 98.42, 98.23, 97.97, 97.81

Resistance Levels today:
99.00, 98.94, 99.13, 99.08, 99.21, 99.31, 99.44, 99.58, 99.81

Tuesday, June 18, 2013

Crude Oil Day trading strategy; Screen to Floor Morning Prep 06/18/13


JOIN HERE


Crude Oil Contract Rollover Alert: 
We will be rolling-forward to the 08-13 contract on Wednesday June 19, 2013.  Today the volume will be ‘split’ between the 07-13 and 08-13 contract, which means we can expect lower volume trading.

Crude Oil Daily Chart:
Crude Oil Daily Chart
The daily chart of Crude Oil shows price-action trading into the sell-zone above the price-wedge with major resistance overhead at 99.44.  We can see that the buyers have a lot of work to do if they want to test the 100.0 level this week, and at any moment this price-action can collapse and move back lower. 


Crude Oil 240-Minute Chart:
Crude Oil 240-Minute
The 4-hour chart of Crude Oil shows us trading higher in the long term, but lower in the short term inside the bullish price-channel.  We have identified major resistance above us at 100.23, and we can see the big-round-number of 100.00 just inches away as well.  We can see some big clues in the candlesticks on this 4-hour chart.  The big wicks over the last 10 candles tells us the buyers are struggling to keep prices higher, and this market personality appears to want to collapse as we go into the opening bell.  We have identified a trend line support and a buy-zone at 95.00, so we can sell short as long as we have enough room before we test the trend line, down to the trend line and the 95.00 and then look for the buy-zone to hold and we can then buy it back up. 

Crude Oil 60-Minute Chart:
Crude Oil 60-Minute Chart
The hourly anchor chart shows us the most important clues for intra-day trading.  We can see the same bull price-channel, telling us the high-percentage-trades will occur at the trend line support or the lows of the price-channel, so we need to stay patient this morning for price-action to push lower so we can get into position near the lows of the price-channel.  We can see two buy-zones that are important to us today.  First, we are trading on top of the 97.58 buy-zone, which tells us we should see a ‘bounce’ in prices at the open.  Second, the buy-zone at 96.92 is positioned perfectly at the trend line support and near the lows of the price-channel. 

We know that prices are sitting on support, so they can move higher at ANY time right now and we will buy pullbacks with the long-term trend.  The goal is for prices to collapse below the 97.31 and then give us a possible high-percentage-buy around the 96.92 or 96.52 areas later this morning this morning.

Crude Oil 5-Minute VIP Chart:
Crude Oil 5-Minute VIP Chart
We have BIG clues on this morning’s VIP chart for Crude Oil.  First, we can see the trading-range is very narrow coming out of overnight trading in London, which tells us to expect narrow price-action this morning.  We will buy the lows, sell the highs, and treat this market personality as range-bound early in the trading session, looking for the market personality to change to a breakout personality.  We have support levels below us, resistance levels above us, and we will be looking for price-reversals at each of these levels this morning as we trade this range-bound market today. 


Keep in mind the anchor charts do suggest a bullish long-term trend so the high-percentage-trades this morning will be to the LONG side.