Wednesday, July 31, 2013

Crude Oil Day trading strategy; Screen to Floor Morning Prep 07/31/13


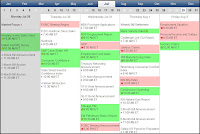
News Worksheet
Crude Oil Inventory Numbers

Marty's PIT Session Notes

Marty's PIT Session levels


Crude Oil 240-minute:

Crude Oil 240-Minute
Crude Oil continues to show a bearish long-term trend on our 4-hour anchor chart, which a bearish price-channel telling us the story.

We can see support levels below us at 103.15, 102.23, 100.75 and 100.69 which we will use for our profit-targets as we look for selling-opportunities this morning.

It is important to notice that at this time we appear to be stalled-out at the 103.15 buy-zone, so let’s look closer at the faster time frame to get some more clues for exact entries today.


Crude Oil 60-minute:

Crude Oil 60-Minute
The hourly anchor chart shows us a lot more details, and provides us with important information we will use to plan our first trade of the day today.
We can see the bear price-channel very easily, but the most important thing is where we are inside this price-channel.  We are trading in the middle of the price-channel in a sideways-trading-range. 

We know that a bear price-channel tells us to sell at the highs and sell retracements with new lower-lows on the way down.  We are not at the highs of the price-channel and we are not making new lower-lows at this time, therefor we know that we will have to wait for the high-percentage-trades this morning.

Our day trading plan will be to sell the highs of the price-channel if price-action tests the 104.00 area.  If we get price-action to make new lower-lows we will return to selling retracements using our wave-pattern-short.

Crude Oil 5-Minute:

Crude Oil 5-Minute
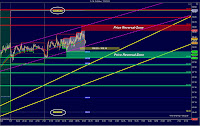
We can see a very clear picture of the overnight market personality on the 5-minute chart of Crude Oil.  We want to look at the market personality coming out of the London trading Session for clues in what the first few hours of the morning will look like.

We can see a very narrow trading-range coming out of London.  With only 58-cents of trading-range we can assume that market personality is waiting on SOMETHING today.  With today being FOMC-Day and Inventory Day this may take some time before we get the breakout of this trading-range we need.
As we discussed earlier, we want to see price-action rise to the highs of the range so we can sell short, or we want new lower-lows so we can sell short with the wave-pattern-short.

Keep a close eye on the PHOD and PLOD levels today; they will be key turning points for us.  We will be look for the fake-out-breakout around the PHOD and PLOD and will use our Inside-Out Set-up to buy the lows and sell the highs of the range from Tuesday.

Stay patient today, wait for new lower-lows to sell retracements or new higher-highs to buy pullbacks.  The key to remember is the bearish price-channel tells us the easy money will be selling short this morning.

Tuesday, July 30, 2013

Crude Oil Day trading strategy; Screen to Floor Morning Prep 07/30/13


"The downtrend will begin below the 102.57" - Crude Oil Kid


Marty's PIT Session Levels
Marty's PIT Session Notes

News Worksheet
This morning we have some great trading opportunities with the news on the schedule ahead of us.  We begin the 2-day FOMC Meeting this morning, and we have major news at 9:00am and 10:00am EST. 

We are trading into the end of the month of July, so we know that this price-action will be a little different as traders are forced to participate as the month closes out.

Crude Oil 240-minute:
Crude Oil 4-Hour 
The 4-hour anchor chart shows us trending lower this morning.  We can see the recent high of 108.93 has resulted in profit-taking at the highs as we change direction and move lower.  We can see the change in the long-term trend on Monday and we will use this as a big clue to keep selling short this morning with our members in the live trade-room.


Crude Oil 60-minute:
Crude Oil 60-Minute 
The hourly anchor chart reminds us WHY this price-action has been so choppy moving lower.  We can see the symmetry buy-zone from 104.08 down to 103.33, which is clearly to blame for the price-action ‘grinding’ lower late last week and on Monday.  We’ve seen clearly bearish market sentiment but we’ve also notice sloppy price-action moving lower, and this explains WHY. 

Our day trading plan will still be the same today; we want to sell retracements with new lower-lows as price-action drops.  We also know that there is room to buy in the short term, and we will use the highs of the bear price-channel as our profit-target for the buying opportunities today.

Crude Oil Entry Timeframe:
Crude Oil 987-Tick
We can see the almost-sideways bearish price-channel on the entry chart this morning, which confirms this sloppy price-action moving lower into major support on the anchor charts.

If you recall, we have a major buy-zone on the 60-minute chart, and we can see what this support level is doing to the price-action.  We know we want to sell the highs of this price-channel, and the long-term trend moving lower tells us that selling short will be the high-percentage-trades today.

===========================================================
Want to see me trade LIVE? 
Subscribe to our Morning Newsletter.  Click here
Are you a Crude Oil Trader? Click here to trade Crude Oil
Are you a Euro Trader? Click here to trade Euro
Are you an E-Mini Russell Trader? Click here to trade E-Mini Russell
Are you a Gold Trader? Click here to trade Gold
Join the Premier Live trade-room as an Advanced Member
Our Live trade-room is open for TRIAL MEMBERS. 
**2013 Members Summit & Trading Seminar**

Monday, July 29, 2013

Crude Oil Day Trading Strategy Morning Prep; Screen to Floor 07/29/13


Today's Economic News


Crude Oil 240-minute:
Crude Oil 240-Minute
Crude Oil is trading in a bearish price-channel coming off the highs at 108.93 on the 4-hour anchor chart.  This chart shows us the trend is about to change to bearish as well, so we will be looking for selling-opportunities as the high-percentage-trades this morning.
Profit-targets below us will be at the lows of the price-channel, the trigger-line at 102.02 and the trigger-zone at 100.69.

Crude Oil 60-minute:
Crude Oil 60-Minute Chart
The hourly anchor chart does a very good job illustrating a sideways-trading-range for us this morning.  We can see the symmetry buy-zone has held three (3) times since we tested it initially last week.  With a trend-line and range-highs at 105.87 we can assume this price-action will keep trading inside this range until something substantial changes the perception of ‘value’. 
With a light news day ahead of us, we will plan on using this trading-range as our biggest trading clue this morning.  We will buy the 104.08 and sell the 105.87, avoiding the middle of the trading-range around 105.25 if possible.

Crude Oil Entry Time frame:
Crude Oil 5-Minute Chart
The 987-tick chart is clearly trading in a sideways-trading-range with a slight bearish tone to it this morning.  The ‘cloud’ appears to be very narrow, and we can see the highs and lows of the range quite easily on this chart.


Crude Oil 987-Tick Chart
Our day trading plan this morning will be to look for buying opportunities at the lows of the range, and selling-opportunities at the highs of the range.  If/when we breakout of this trading-range we will then look to sell retracements and buy pullbacks.

Friday, July 26, 2013

Crude Oil Morning Prep Day Trading Strategy; Screen to Floor 07/26/13


Economic News Worksheet


Marty's PIT Session Direction

Marty's PIT Session LEVELS


Crude Oil 240-Minute / 4-Hour:
Crude Oil 60-Minute
Crude Oil is trading lower this morning just below the 105.00 big-round-number.  We tested the symmetry support level at 104.08 on Thursday and bounced as high as 105.87.  We will define this as our most important trading-range this morning from 105.87 down to 104.08, and our goal will be to buy at the lows and sell at the highs of this range.  If we can break above the 105.87 we know the bulls are in control and we are buying pullbacks.  If we break below the 104.08 we will assume the sellers are back in control and we will sell retracements.  As we trade inside this range we will buy-the-lows at support and sell-the-high at resistance.


This is just a snapshot of our Morning-newsletter which is posted every trading day at 8:00am EST in our Members Section.

Crude Oil 60-Minute:
Crude Oil 240-Minute
We can see Crude Oil trading inside the range from 105.87 to 104.08 this morning on the 60-minute chart, which means we will use this as our main focus until something pushes us outside of it.  We can see price-action has stalled around the trigger-zone at 104.80 and we will be waiting to see where price-action goes next.  We are looking to buy the 104.08 as support and sell the 105.87 as resistance this morning, and if we see a breakout of this range we will then proceed to buy pullbacks with new higher-highs or sell retracements with new lower-lows.

Crude Oil Entry Chart:

Crude Oil 987-Tick
Our 987-tick entry chart of Crude Oil shows a similar situation; we can see the range highs and lows and a recent sideways-trading-range around 104.80.  Our best option for this morning’s trading plan is to wait for prices to test the highs or the lows of this range because that is where the most reaction will occur and we should see the best price-action.


Crude Oil 5-Minute:


We can see that price is inside the trading range from yesterday, and we will look for a price reversal at the PLOD at 104.08.   We notice the previous week's lows at 104.42 as well, which tells us that if this price fails to move and stay below this level we can assume the BULLS are still in control over this price action and price will most likely rise this morning.

Thursday, July 25, 2013

07 25 13 Crude Oil Morning Prep; SchoolOfTrade Trader s Audio


Another exciting day of trading ahead of us!  2 major news reports should get us trading early this morning

Crude Oil Day Trading Strategy Morning Prep; Screen to Floor 07/25/13


Marty's PIT Levels


Today's News Schedule


Crude Oil 240-Minute / 4-Hour:
Crude Oil 4-Hour Chart
Crude Oil is pushing lower this morning and our 4-hour anchor chart shows us a few very important clues.  

First, we can see the trading-range from 108.93 down to 104.08 and we are almost down to the lows of this range where we will find demand (support).  

Second, we can see the trigger-zone support at 105.12 down to 104.63 doesn't appear to be strong enough to hold off the sellers.  

Third, we can see the new symmetry pattern formed with the AB=CD Pattern and support levels at 107.08 and 103.30.

This 4-hour chart tells us that price will likely test the lows of this range, at which point we will look to buy the lows as support.  If the sellers are too strong they will push lower into the symmetry buy-zone and we will be looking for a price-reversal at the 103.30 level.

This is just a snapshot of our Morning-newsletter which is posted every trading day at 8:00am EST in our Members Section.

Crude Oil 60-Minute:
Crude Oil Hourly Chart
The 60-minute anchor chart of Crude Oil shows us much of the same information from the 4-hour chart.  We can see this buy-zone from 104.08 down to 103.33 which we will use to look for a price-reversal and a buying-opportunity later this morning.  In the early part of the trading session today we expect to see prices continue to push lower down to the 104.08 range-lows.


Crude Oil Entry Chart:

Crude Oil Entry Chart
The 987-tick entry chart time frame for Crude Oil shows us trading lower in a bearish price-channel and a red cloud-cover.  We have price-action below the red cloud-cover which tells us that selling short will be our high-percentage-trades at this time.  We will now move to a slightly faster timeframe to look for the Wave pattern short.

Wednesday, July 24, 2013

Crude Oil Day Trading Morning Prep Strategy; Screen to Floor 07/24/13


Today's Economic News 


Crude Oil 240-Minute / 4-Hour:
Crude Oil 240-Minute Chart
We can see a sideways-trading-range on the 4-hour anchor chart of Crude Oil this morning.  We’ve come off the highs at 108.93 and the trading-range goes down to 104.08.  We know that buying the lows, selling the highs, and avoiding the middle of this range is where we will see the high-percentage-trades today. 


This is just a snapshot of our Morning-newsletter which is posted every trading day at 8:00am EST in our Members Section.


Crude Oil 60-Minute:
Crude Oil 60-Minute Chart
The hourly anchor chart shows us much of the same from the 4-hour.  We can see trend-lines overhead and below that create the price-wedge along with a trigger-zone support at 106.51 and above us at 108.19.  We know that a price-wedge is a very important clue that tells us to treat this market personality as range-bound and look to buy at the lows and sell at the highs. 

As of 7:00am EST today we are trading in the middle of the price-wedge so we need to be patient this morning.

Crude Oil Entry Chart:
Crude Oil 987Tick Chart
Our entry chart of Crude Oil shows us a very narrow trading-range this morning.  We’ve come off the lows at 105.45 and now we’re looking like the market personality needs a kick-start this morning before we start trading Crude Oil. 


Look for news starting at 9:00am EST this morning to give this market personality a kick in the pants because we need new higher-highs or lower-lows to get us trading this today.


Crude Oil Inventory Numbers

Marty's PIT Levels


Marty's PIT Notes


Tuesday, July 23, 2013

Crude Oil Morning Prep Day Trading Strategy; Screen to Floor 07/23/13


Marty's PIT Levels
Marty's Pit Notes
Economic News


Crude Oil 240-Minute / 4-Hour:
Crude Oil 4-Hour
The 4-hour anchor chart of Crude Oil shows us coming off the highs at 108.93 as we trade lower to the next swing-low and major support at 104.88 and 104.08.  We can see a lot of room for price-action to move lower this morning as it moves down to the trigger-zone at 100.69.


This is just a snapshot of our Morning-newsletter which is posted every trading day at 8:00am EST in our Members Section.

Crude Oil 60-Minute:
Crude Oil 60-Minute
The hourly anchor chart shows us a price-wedge structure with a trend-line overhead as resistance and a trend-line below us as support.  We can see the trigger-zone from 106.51 down to 105.93 and we are currently stuck trading inside of this range as we open the morning session in the US.  This chart tells us to expect support to be in the market at this area so prices will likely bounce higher this morning before trying to move lower once again.

Crude Oil Entry Chart:

Crude Oil 987-Tick
Using the 987-tick chart as the anchor to our entry charts we can see a trading-range with the lows at 106.00 and a trigger-zone overhead at 106.61.  If prices rise higher we will look for a Wave pattern long up to the 106.61 profit-target.  If we want to get trading short we need to see new lower-lows below 106.00 and we will sell retracements from there.

Monday, July 22, 2013

Avoid a Loss for easy Winning Trades on Crude Oil

Crude Oil Morning Prep Day Trading Strategy; Screen to Floor 07/22/13


Marty's PIT Levels
Marty's PIT Notes


Economic News Today


Crude Oil Daily:

Crude Oil’s daily anchor chart shows us trading up near the resistance at the highs of the bull price-channel.  We can see a little room to breathe at these highs, but we are very close nonetheless.  


Crude Oil 60-Minute:
The hourly chart of Crude Oil shows us trading in a bull price-channel with a VERY narrow trading-range in the recent few hours of trading.  It looks like we have higher-highs and higher-lows on this price-action even though it is very concerning how the price-action appears to be very narrow so we will take that into considering in our day trading plan today.


This is just a snapshot of our Morning-newsletter which is posted every trading day at 8:00am EST in our Members Section.

Crude Oil 5-Minute:
Crude Oil is trading in a very narrow trading-range this morning as we come out of the overnight London trading Session.  The most important thing to remember with a narrow like this is to buy-the-lows at support and sell-the-high at resistance until we get a successful breakout in price-action and a new short-term trend.  We can see a short term bull price-channel has formed, which tells us that buying at support levels on the way higher will be where the high-percentage-trades occur this morning.

PRZ-Trade today:
Short @ 108.64

Long @ 108.00

Friday, July 19, 2013

Morning Prep Crude Oil Day Trading Strategy; Screen to Floor 07/19/13


Contract Rollover Alert:
Please be aware that we have rolled forward to the 09-13 contract of Crude Oil Futures this morning.


Crude Oil 60-Minute:
Crude Oil is moving higher this morning ahead of OPEX as it pushes above the 108.00 big-round-number on the 60-minute anchor chart.

We can see the bullish price-channel and we are about 50% of the way up off the lows at this time.  Considering the bull price-channel we want to buy pullbacks with new higher-highs; however we are in the middle of this price-channel so we can also expect prices to be a little less consistent than if we were trading at the lows.

The high-percentage-trades will occur buying the lows of the price-channel, and buying pullbacks with new higher-highs this morning.

This is just a snapshot of our Morning-newsletter which is posted every trading day at 8:00am EST in our Members Section.

Crude Oil 5-Minute:
We can see that price-action is trading at the highs of the London trading Session range this morning at 700am EST.  We can see that price is above the highs from yesterday at 107.81 and the highs from last week at 107.22.

At this time price-action is trading inside the range from overnight, which means we will treat this as a neutral market personality.  Once we breakout above or below the price reversal-zone we will then consider this market personality to be bullish above the highs or bearish below the lows. 

PRZ-Trade today:
Short @ 108.31
Long @ 107.34