 |
| PIT Session Notes |
 |
| PIT Session Price Levels |
Economic news today:
 This morning
is Quadruple
Witching Friday, which means today is the final trading day before all
4 asset-classes expire on Saturday. The
result of this will be lower-than-usual trading volume, and a lack of
consistency in the price-action on our charts.
Traders are encouraged to trade lightly this morning, using smaller
contract sizes, and being more conservative with risk-management.
Crude Oil Daily Chart:
 |
| Crude Oil Daily |
It appears
we were very accurate in our Thursday morning prediction of a sell-off and this
morning we finish up a week of trading with a large GAP in price on the daily
chart with price sitting on top of the 95.43 buy-zone, which was identified
earlier this week. This daily chart
tells us that we are sitting at support on this chart, which means we may see a
rally this morning back higher, or the buyers may fail and this price can keep
tumbling lower back to the 92.00 level.
Crude Oil 240-Minute
Chart:
 |
| Crude Oil 4-Hour |
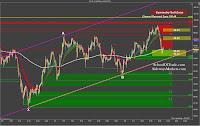
The 4-hour
anchor chart shows us a lot more details this morning, which we will use to
make educated trading-decisions this morning.
First, if you recall from Thursday we discussed that buying the lows of
the price-channel would be the high-percentage-trades of the week, and we are
now trading at those lows. We will be
looking for buying opportunities this this morning with price-action sitting on
top of major support at the price-channel lows and a profit-target at 96.92 and
98.23.
We should
also be aware that if price keeps dropping lower this morning we also can buy
the lows of the price-channel as far down as 93.94 so we will look for the high-percentage
patterns for entry long, but if that isn’t working and prices slip back lower
we still can be patient for another buying opportunity.
Crude Oil 60-Minute
Chart:
 |
| Crude Oil 60-Minute |
The hourly
anchor chart tells us exactly what to expect in the short-term trend this
morning we go into Quadruple Witching Friday.
First, we must remember that this morning is going to be sloppy. Most of the professionals on the trading
floor will NOT be trading today, which means lower volume and less consistency
in the trades that we take. For that
reason, we must use caution this morning.
The
60-minute anchor chart shows us bouncing off the 95.00 big-round-number as we
tumbled off the weekly highs. We want to
buy this dip in prices, the 4-hour chart shows us trading at the lows of a price-price-channel,
but we have some resistance in our way. Price-action
is testing the 95.46 sell-zone right now, which means we can expect to see
lower prices before we see higher prices this morning.
The
60-minute chart of Crude Oil tells us to wait and buy a pullback this morning at
95.24 before trying to buy into the sell-zone overhead. We will look for profit-targets overhead
around 95.86, 96.14, 96.56 and 96.80.
Crude Oil 5-Minute VIP
Chart:
 |
| Crude Oil 5-minute VIP |
The 5-minute
VIP chart shows us a very narrow trading-range overnight as professional
traders are stepping away from their desks for Quadruple Witching Friday. A narrow trading range tells us to be careful
this morning with fake-out-breakouts and to look for buying opportunities at
the support levels below, and selling opportunities at resistance overhead. If prices push lower this morning we are looking
for the high-percentage-trades to buy around 95.24 down to 95.09. If prices rise higher this morning we are
buying pullbacks above the lows of the London trading Session and taking a profit-target
at the reversal zone at 95.84.
Support Levels for
Today:
95.41,
95.29, 95.24, 95.14, 95.09, 94.98, trend line around 94.85, and 94.71.
Resistance Levels for
Today:
95.57, 95.63,
95.72, 95.78, 95.84, 95.96, 96.11, 96.27 and 96.54
No comments:
Post a Comment