Thursday, June 20, 2013

Crude Oil Morning Prep; Screen to Floor 06/20/13


PIT Session Notes
PIT Session Levels


Economic News this morning:
We have major economic news on the calendar this morning starting with Jobless Claims at 8:30am EST.   We have the Philly Fed Index & Existing Home Sales at 10:00am EST this morning, and for all the Natural-Gas traders we have Inventories at 10:30am EST.
Crude Oil Daily Chart:
Crude Oil Daily
This morning we can see that the sell-zone overhead has held with too much supply entering the market after the FOMC Report on Wednesday, and prices have dropped off the recent highs as we go into the opening bell in the US morning trading session.  We have defined a daily support level of 95.43 below us this morning, which should be a target for the sellers over the next 2 days.

Crude Oil 240-minute chart:
Crude Oil 240-Minute 
The 4-hour anchor chart shows us that prices have dropped off their multi-week highs and have landed on top of trend line support and buy-zone support at 96.74 down to 96.15.  This is a VERY important area for Crude Oil traders this morning.  If prices can successfully climb back higher we will likely see prices move up to 100.0 and possibly 101.0 over the next week.  On the other hand, if prices collapse below the 96.15 we then know that the buyers have failed, the sellers will take control, and prices will drop to 95.35 and 94.43. 

The bull price-channel on this 4-hour chart still tells us to buy pullbacks at support, so look for rising prices EARLY this morning to get into these long positions.  We also know that if we do NOT see those rising prices we will likely see a collapse and we will look for selling opportunities down to the 95.35 buy-zone below us.

Crude Oil 60-Minute Chart:
Crude Oil 60-Minute
The hourly anchor chart of Crude Oil shows us just how much of a drop in prices we’ve seen over the last 24-hours.  Clearly the reaction to the FOMC Announcement on Wednesday was bearish, so this morning we can see price-action resting on top of a trend line in the middle of a range between buy-zones below at 95.86 and the next sell-zone overhead at 96.73, 97.63, and 97.93. 

We can easily see that the price level at 96.50 is an important turning point in the market this week.  If prices rises back higher from here we know this reaction to the news on Wednesday was just a pullback in the long-term trend going higher.  If we do not see prices move higher we know this ‘pullback’ is more like a price-reversal and we will see prices tumble lower to the 95.86, 95.59 and possibly the 94.75.

Crude Oil 5-Minute VIP:
Crude Oil 5-Minute
The 5-minute chart on Crude Oil shows us a narrow trading range, and we are right in the middle of the overnight trading session.  This market personality tells us that ANYTHING can happen this morning.  We expect to see short term bullish market sentiment this morning as the traders in the US return to their desks, however we do not know if these bulls will last very long because of the bearish news from the FED on Wednesday.

The day trading plan this morning for Crude Oil is to determine the market sentiment as we come off major news from the FED and look for clues to see where the traders are going to go from here.  We can easily see prices jump higher this morning after the big sell-off overnight, but we would also see the sellers come back in this morning and this price may keep tumbling lower.  As of 8:00am EST we are selling at resistance, and buying at support and waiting to see where the long-term trend will be this morning so we can trade along with it.

Support Levels today: 
96.05, 95.73, 95.32, 94.87, 94.26, 94.14
Resistance Levels today:

97.23, 97.55, 97.63, 98.00, 98.41, 98.53, 98.85, 99.14, 99.21

Wednesday, June 19, 2013

Crude Oil Morning Prep; Screen to Floor 06/19/13


Join us HERE.

Marty's PIT Session Levels


Crude Oil Contract Rollover Alert:
This morning we have rollover-over to the next front-month contract for Crude Oil Futures.  This morning we move to the 08-13 Futures contract, and you can learn more about how to accomplish this here.

Economic News Alert:
This morning has 4 big news events that we need to be aware of.  First, today is Wednesday of OPEX, so we know that today is called ‘wacky Wednesday’.  Second, we have contract rollover on Crude Oil which will have traders moving to the new 08-13 contract.  Third, we have Crude Oil inventories today at 10:30am EST which will have traders waiting to hear from the EIA to see if there was another draw in Crude Oil inventories to support higher prices this week.  Fourth, today is FED DAY or FOMC Day, which means today we will hear from the Federal Reserve Bank in the US with their announcement at 12:15pm and the Press Conference at 2:15pm EST this afternoon. 

Crude Oil daily chart:
Crude Oil Daily Chart
The daily chart of Crude Oil shows us exactly what was expected earlier this week; we can see rising prices on the way up to the 100.00 big-round-number overhead.  We can see that price-action is pushing into a sell-zone at this time, with major resistance at 99.44, and the highs of the price-channel.  We can expect prices will continue to push higher until we test 100.00, and we expect to see prices attempt to test the highs of the bullish price-channel. Join us HERE.

Crude Oil 240-Minute:
Crude Oil 240-Minute Chart
The 4-hour anchor chart shows us wide open space above us on the way higher to 100.00.  We have been calling this market personality bullish all week, and this morning it is likely to continue.  We can clearly see the bullish price-action pushing higher this morning, telling us that buying at support with a price-reversal or buying pullbacks will easily be the high-percentage-trades this morning.   We have our next sell-zone overhead at 99.51 and that is our short term profit-target this morning.  Our long term target today and tomorrow will be 100.00 and 100.40.

Crude Oil 60-Minute chart:
Crude Oil 60-Minute Chart
The hourly anchor chart shows us a lot of important clues to help us get started trading this morning with the long-term trend.  First, we can see the bullish price-channel tells us to buy pullbacks with new higher-highs and to look for price-reversals at support levels below us to get LONG.  Second, we can see short term buy-zones below us at 98.41, 98.22, 97.94 and 97.78 which we will use to buy at support this morning if price pulls back from the overnight highs.  Third, we can see a wide open space above the sell-zone at 99.15 which tells us that if price-action jumps higher we can easily buy pullbacks using our simple entry rules, using the top of the price-channel and 100.0 big-round-number as our profit-targets above us.  Join us HERE.

Crude Oil 5-Minute VIP Chart:
Crude Oil 5-Minute VIP Chart
We can see a narrow overnight trading range this morning on the VIP-Chart, with plenty of locations to look for buying opportunities this morning at the levels of support we’ve located on this chart.  Look for key price-reversal locations around the reversal-zone at 98.84, the trigger-zones at 98.42 and 97.97 this morning, and remember the long-term trend is bullish so we will be looking for price-reversals off these support levels below. 

Support levels today: 
98.84, 98.74, 98.61, 98.47, 98.42, 98.23, 97.97, 97.81

Resistance Levels today:
99.00, 98.94, 99.13, 99.08, 99.21, 99.31, 99.44, 99.58, 99.81

Tuesday, June 18, 2013

Crude Oil Day trading strategy; Screen to Floor Morning Prep 06/18/13


JOIN HERE


Crude Oil Contract Rollover Alert: 
We will be rolling-forward to the 08-13 contract on Wednesday June 19, 2013.  Today the volume will be ‘split’ between the 07-13 and 08-13 contract, which means we can expect lower volume trading.

Crude Oil Daily Chart:
Crude Oil Daily Chart
The daily chart of Crude Oil shows price-action trading into the sell-zone above the price-wedge with major resistance overhead at 99.44.  We can see that the buyers have a lot of work to do if they want to test the 100.0 level this week, and at any moment this price-action can collapse and move back lower. 


Crude Oil 240-Minute Chart:
Crude Oil 240-Minute
The 4-hour chart of Crude Oil shows us trading higher in the long term, but lower in the short term inside the bullish price-channel.  We have identified major resistance above us at 100.23, and we can see the big-round-number of 100.00 just inches away as well.  We can see some big clues in the candlesticks on this 4-hour chart.  The big wicks over the last 10 candles tells us the buyers are struggling to keep prices higher, and this market personality appears to want to collapse as we go into the opening bell.  We have identified a trend line support and a buy-zone at 95.00, so we can sell short as long as we have enough room before we test the trend line, down to the trend line and the 95.00 and then look for the buy-zone to hold and we can then buy it back up. 

Crude Oil 60-Minute Chart:
Crude Oil 60-Minute Chart
The hourly anchor chart shows us the most important clues for intra-day trading.  We can see the same bull price-channel, telling us the high-percentage-trades will occur at the trend line support or the lows of the price-channel, so we need to stay patient this morning for price-action to push lower so we can get into position near the lows of the price-channel.  We can see two buy-zones that are important to us today.  First, we are trading on top of the 97.58 buy-zone, which tells us we should see a ‘bounce’ in prices at the open.  Second, the buy-zone at 96.92 is positioned perfectly at the trend line support and near the lows of the price-channel. 

We know that prices are sitting on support, so they can move higher at ANY time right now and we will buy pullbacks with the long-term trend.  The goal is for prices to collapse below the 97.31 and then give us a possible high-percentage-buy around the 96.92 or 96.52 areas later this morning this morning.

Crude Oil 5-Minute VIP Chart:
Crude Oil 5-Minute VIP Chart
We have BIG clues on this morning’s VIP chart for Crude Oil.  First, we can see the trading-range is very narrow coming out of overnight trading in London, which tells us to expect narrow price-action this morning.  We will buy the lows, sell the highs, and treat this market personality as range-bound early in the trading session, looking for the market personality to change to a breakout personality.  We have support levels below us, resistance levels above us, and we will be looking for price-reversals at each of these levels this morning as we trade this range-bound market today. 


Keep in mind the anchor charts do suggest a bullish long-term trend so the high-percentage-trades this morning will be to the LONG side.

Monday, June 17, 2013

Crude Oil Morning Prep 06/17/13


 Crude Oil Weekly & Daily Charts:
Crude Oil Daily Chart
Crude Oil Weekly Chart
The Crude Oil weekly chart shows us 2 big clues this morning as we begin a new week.  First, we see the short term sideways-trading-range from 99.44 down to 86.57.  Second, we have a price-wedge structure that has the highs above us around 103.28 and the lows down around 90.00.  We can see that this chart tells us to buy pullbacks this WEEK for the high-percentage-trades as prices will likely test the 100.0 big-round-number as price rise in the summertime.

Crude Oil 240-minute chart:
Crude Oil 4-Hour Chart
The 4-hour chart of Crude Oil shows us this big bullish price-channel with a projected high at 100.23 before we pull back and re-test the lows.  We can see there are only a few sell-zones above us acting as resistance standing in our way before we test the 100.0 big-round-number.   Look for easy profit-targets on the way higher at 98.61, 99.29, 100.00 and 100.23.  This 4-hour chart continues to tell us the bulls are in control, so we are buying pullbacks on the way higher.

Crude Oil 60-Minute Chart:
Crude Oil Hourly Chart
We can see a similar bull price-channel on this hourly chart this morning, along with some clear buying opportunities at 98.06, 97.67, 97.51, 97.10, and 96.52.  The most recent 60-minute candlestick is considered bearish, with a big wick at the highs, which tells us to be ready to buy in the 98.08 range as this price-action pulls back before moving higher.

Crude Oil VIP Chart:
Crude Oil VIP Chart
Our VIP-Chart of Crude Oil tells us exactly where we are going to enter and exit our trades today.  Remember, the slower timeframe charts told us to buy pullbacks this morning, and this faster timeframe shows us that buying at the levels below us will be where we see the high-percentage-trades this morning.  I am buying at 98.03, 97.87, 97.76, 97.51, and 97.38 as we pull back off these highs.  As prices move higher I am looking for a profit-target above us at 98.92, 99.23, and 99.58 overhead.

Friday, June 14, 2013

Crude Oil Day trading strategy 06/14/13


Marty's PIT Numbers

PIT Session Price Levels


Crude Oil VIP Chart
We can see the bullish price-channel has continued this morning on Crude Oil Futures and this tells us that buying pullbacks after testing support levels below us will be where we see the high-percentage-trades this morning.  This type of market personality can be a challenge to rookie traders because the price-action will try to push higher, but we are at the completion of symmetry, clearly over-bought, so we need to wait for DEEP pullbacks to ensure we get into our long trades at the best location possible.  We certainly don’t want to buy the highs of ANY range, so stay patient and wait for price-action to pullback off these highs and take the buying opportunity using a pullback.  

We can see buy-zones below us at 96.16 and 95.15 for the best buying opportunities this morning.

Resistance levels today:    97.30, 97.54, 97.84, 98.17, 98.71
Support Levels today:       96.87, 96.62, 96.43, 96.19, 95.89, 95.56, 95.02

Thursday, June 13, 2013

Crude Oil day trading plan 06/13/13


Martys PIT Levels
Crude Oil PIT Levels

Crude Oil 4-Hour
The 4-hour chart of Crude Oil shows us trading in the middle of a price-wedge with buy and sell-zones above and below us this morning, which suggests overall 2-sided market personality going into this morning’s trading session.  

We can see the broken bearish price-channel resulted in strong resistance at 96.49 with a double-top at the highs.  If prices rise higher the buyers will have to push through the highs of the price-wedge and the price-reversal zone from 96.49 up to 97.19.  If prices fall this morning we have buyers entering at the lows of the price-channel, and there are three (3) double-top price-reversal levels below it starting at 93.75.  The biggest clue on this chart is the price-wedge so look for fake-out-breakouts of short term trading ranges, buying the lows, selling the highs, and avoiding the middle of the price-wedge today.

Crude Oil 60-minute
The 60-minute anchor chart shows us a bullish channel and a short term price wedge, which tells us that buying pullbacks at support levels on the way higher will be the higher percentage trades today.


Crude Oil 5-Minute
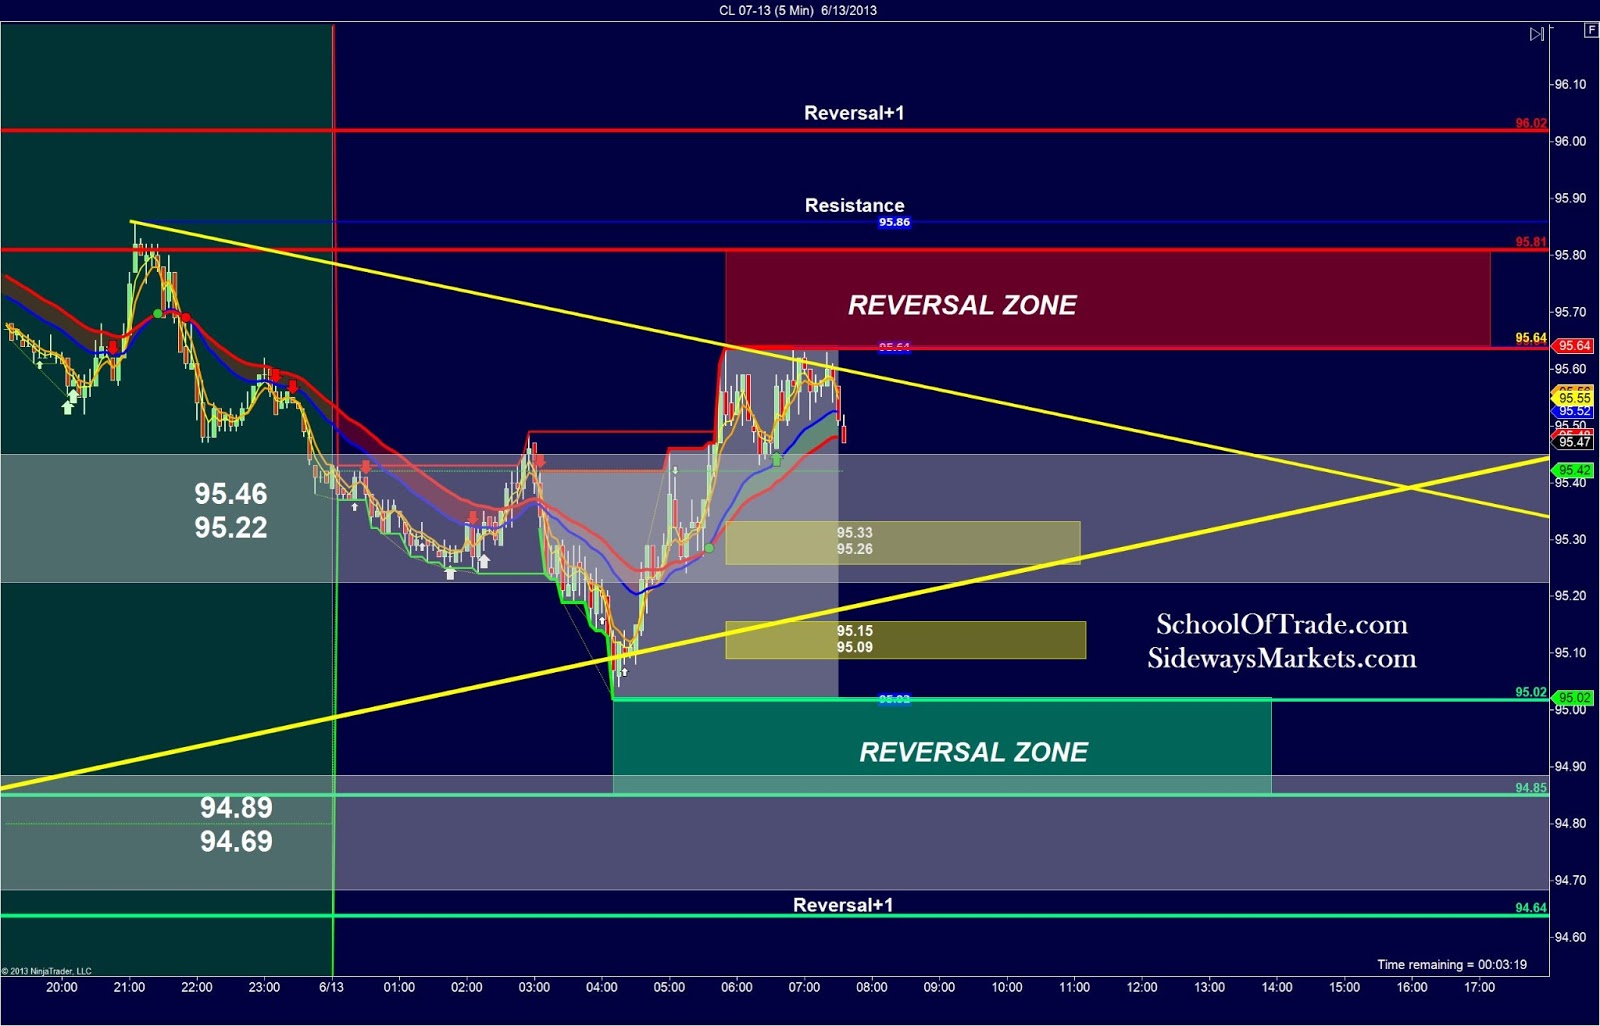
We are seeing 2-sided trading this morning on the short term charts for Crude Oil which tells us to buy the lows, sell the highs, and be aware that major news this morning is due to be released at 830am EST which is expected to push prices around nicely this morning.

Wednesday, June 12, 2013

Crude Oil Day trading strategy for 06/12/13


Marty's PIT Session Levels


Crude Oil Daily Chart

The daily chart of Crude Oil shows us pushing to the highs of the price-wedge with bullish candlestick patterns and large wicks at the bottom of the last 2 days of daily candles.  This suggests rising prices as we go into the bottom-half of the week.


Crude Oil 60-Minute Chart
The hourly anchor chart of Crude Oil shows us the same bullish price-channel we used to call a winning trade long on Tuesday morning.  This morning we see that price-action has moved to the highs of a price-wedge which means this morning may be a challenge for us as traders.  The bull price-channel tells us price-action will want to keep rising, but this trend line in our way may say differently.  We know we want to buy pullbacks but this trend line and price-wedge will most likely make buying pullbacks more difficult this morning so we will need to be patient on the way higher today.