|
| Crude Oil Daily |
Crude Oil Daily:
Daily anchor
chart shows us new higher-highs on Monday and this morning we have opened
slightly lower with a red candlestick suggesting prices are moving off these
new highs.
On Monday we
got exactly what we had expected from Crude Oil. We knew morning that today’s price-action
would be sloppy as it pushed higher, and it gave us exactly that. We can see the 96.00 sell-zone has been removed
from this chart because we got a close of the daily candlestick above the highs
of that sell-zone, which leaves us with the next sell-zone at 97.02 and we have
closed below this sell-zone lows so this leaves the door wide open for the
sellers to push this price-action lower this morning.
 |
| Crude Oil 240-Minute |
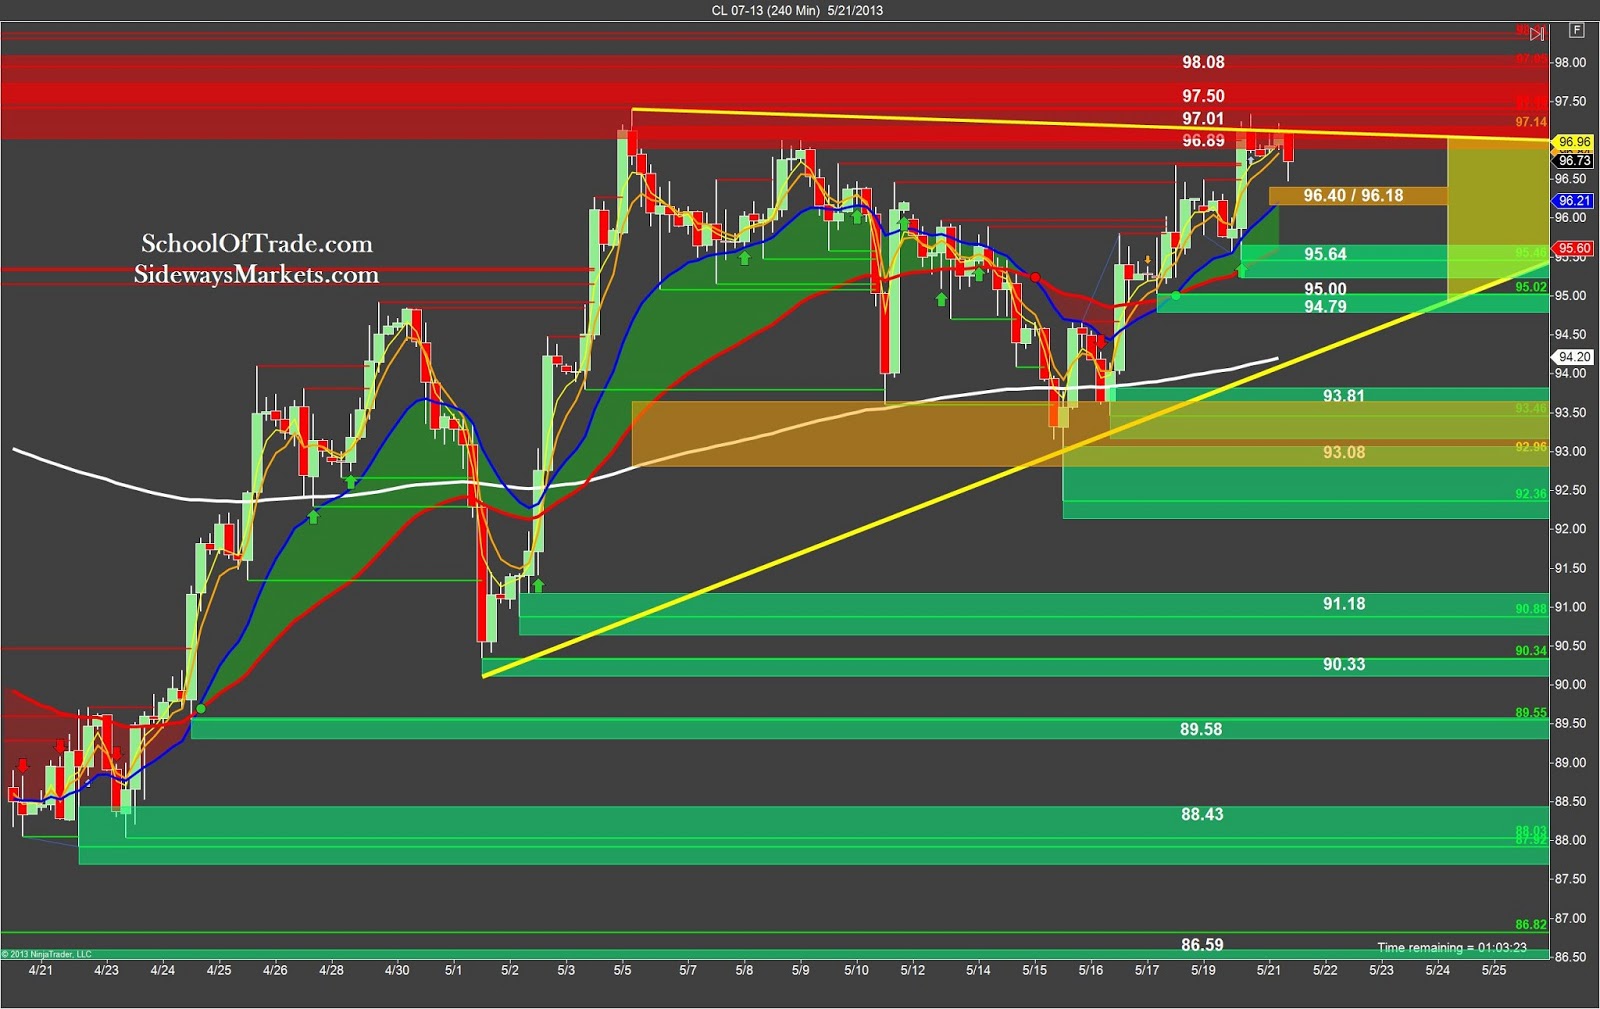
Crude Oil 4-Hour:
The
240-Minute chart shows us that price has pushed through three overhead
sell-zones on its way to settle into the 97.00 big-round-number where we have
more supply entering the market. We can
now see a large RED candlestick has formed most recently which tells us this is
indeed a supply zone in the market. We will
expect prices to push lower on the way down to the buy-zone at 95.64. We can
also see a short term support level at 96.40 which we will use as a profit-target
when selling short, with a runner profit-target at the 95.64.
 |
| Crude Oil 60-Minute |
Crude Oil 60-Minute:
The hourly
anchor chart shows us a BIG set of clues this morning as price-action has
pushed all the way into the major price-channel reversal zone of
97.33-96.72.
This price-reversal
zone comes from that old bearish price-channel below which is marked with the
A, B, and C letters on this chart. Yes,
when we break out of a price-channel we always know there is a price-reversal
zone that will follow it and we will be ready to see price-action tumble off
these highs and fall lower overnight or tomorrow morning.
Do you see this bullish
price-channel? Can you see the
trigger-zone support at 96.40-9.18?
We can
easily see a great buying opportunity around the lows of the price-channel and
the trigger-zone highs at 96.40. If we
get this price-action to fall off these highs we will look for buying
opportunities at these price-channel lows and trigger-zone support. This is a very high-percentage-trade as long
as we don’t get caught buying the lows inside this price-reversal zone. Look for this trade to set-up above or below
the price-channel reversal zone.
 |
| Crude Oil 30-Minute |
Crude Oil 30-Minute:
Look at these big buying clues on the
30-minute anchor chart. The bullish price-channel
tells us that we need to focus our attention on the buying opportunities at the
lows.
We can see price-action
has dropped off these highs (just as we expected at the sell-zone) and now we
find ourselves looking at an excellent buying opportunity at the lows of this
bull price-channel. We are looking for price-action
to test the trigger-zone at 96.40 down to 96.18 for a price-reversal and a buying
opportunity this morning. I have a
feeling we might get a ‘double-bounce’ off this support area because we also
have the Price-channel buy-zone below us at 96.21 down to 95.67. we expect to see the initial test of 96.40
give us an easy scalp trade long, but we will keep our stop-loss tight on the
way up because we assume the sellers will try AGAIN to push lower into the price-channel
buy-zone. If price action gets down into
the price-channel buy-zone we then look for the same price-reversal and using
the Entry-Trigger Indicator we will get long and buy these lows of the price-channel.
 |
| Dollar Index |
Dollar-Index Analysis:
The Dollar-Index
is moving higher this morning in a lovely bullish price-channel on its way into
the double-bottom sell-zone overhead from 84.215 up to 84.325. After see the double-bottom we know the
sellers tried twice and failed both times, giving us a bullish move off these
lows from Monday and sending us into a price-reversal zone above us.
Look closely
and you can see how the Dollar-Index chart confirms exactly what we had
discussed earlier in this post. We
expect Crude Oil to fall into the lows of the price-channel, and with the Dollar-Index
pushing higher we can expect exactly that.
Once the Dollar-Index gives us a price-reversal and starts to move lower
around the 84.325 we then have the perfect buying opportunity on Crude Oil using
the negative Dollar-Index-correlation we always look for. This Dollar-Index is giving us a lot of
confidence in our day trading plan this morning!
 |
| Euro |
Euro Currency Futures Analysis:
The Euro is
moving lower this morning, which is a good confirmation on the lower prices of Crude
Oil this morning along with the rising prices on the Dollar-Index. We can see the Euro approaching the PLOD which
is considered support while the Dollar-Index approaches the price-reversal zone
at the same time.
Aussie Dollar Currency Futures:
 |
| aussie dollar |
The Aussie
is in the same situation as the Euro this morning. We see lower-lows and lower-highs on the way
below the PHOD which is a bearish market sentiment with a short-selling target
of the PLOD 0.9733 on the way down which tells us there is plenty of room to
keep moving lower this morning.
 |
| Crude Oil 5-Minute Chart |